NASA images reveal deformation of Earth’s surface by Mexican quake
24 Jun 2010
NASA has released the first-ever airborne radar images of the deformation in Earth's surface caused by a major earthquake -- the magnitude 7.2 temblor that rocked Mexico's state of Baja California and parts of the American Southwest on April 4.
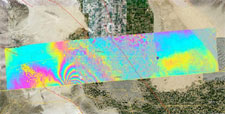 |
| Figure 1. Overview of the UAVSAR interferogram of the magnitude 7.2 Baja California earthquake of April 4, 2010, overlaid atop a Google Earth image of the region. Major fault systems are shown by red lines, while recent aftershocks are denoted by yellow, orange and red dots. Image credit: NASA/JPL/USGS/Google |
The data reveal that in the area studied, the quake moved the Calexico, Calif., region in a downward and southerly direction up to 80 centimeters (31 inches).
A science team at NASA's Jet Propulsion Laboratory, Pasadena, Calif., used the JPL-developed Uninhabited Aerial Vehicle Synthetic Aperture Radar (UAVSAR) to measure surface deformation from the quake. The radar flies at an altitude of 12.5 kilometers (41,000 feet) on a Gulfstream-III aircraft from NASA's Dryden Flight Research Center, Edwards, Calif.
The team used a technique that detects minute changes in the distance between the aircraft and the ground over repeated, GPS-guided flights. The team combined data from flights on Oct. 21, 2009, and April 13, 2010. The resulting maps are called interferograms.
The April 4, 2010, El Mayor-Cucapah quake was centered 52 kilometers (32 miles) south-southeast of Calexico, Calif., in northern Baja California. It occurred along a geologically complex segment of the boundary between the North American and Pacific tectonic plates. The quake, the region's largest in nearly 120 years, was also felt in southern California and parts of Nevada and Arizona. It killed two, injured hundreds and caused substantial damage. There have been thousands of aftershocks, extending from near the northern tip of the Gulf of California to a few miles northwest of the U.S. border. The area northwest of the main rupture, along the trend of California's Elsinore fault, has been especially active, and was the site of a large, magnitude 5.7 aftershock on June 14.
UAVSAR has mapped California's San Andreas and other faults along the plate boundary from north of San Francisco to the Mexican border every six months since spring 2009, looking for ground motion and increased strain along faults. "The goal of the ongoing study is to understand the relative hazard of the San Andreas and faults to its west like the Elsinore and San Jacinto faults, and capture ground displacements from larger quakes," said JPL geophysicist Andrea Donnellan, principal investigator of the UAVSAR project to map and assess seismic hazard in Southern California.