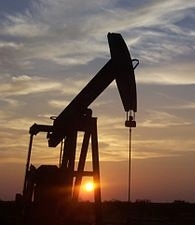
US topples Saudi Arabia as biggest oil producer in 2014
10 Jun 2015
The United States emerged as the world's biggest oil producer in 2014 with estimated production of 11.6 million barrels of oil per day, toppling Opec major Saudi Arabia's 11.5 million bpd production, says a report.
 The US produced 15.9 per cent more oil in 2014 at 11.6 million barrels of oil per day against Saudi Arabia's 11.5 million bpd production, according to BP Plc's Statistical Review of World Energy released today.
US also emerged the world's largest producer of oil and gas with 1,250.4 million tonnes of oil and oil equivalent natural gas in 2014, surpassing Russia's 1,062 million tonnes of oil equivalent.
The shale revolution helped US overtake "Saudi Arabia as the world's biggest oil producer and surpass Russia as the world's largest producer of oil and gas," BP said.
Russia with 10.8 million bpd oil production was placed third after the US and Saudi Arabia.
Consumption all fuels increased, reaching record levels for every fuel type except nuclear power while production increased for all fuels except coal.
For oil and natural gas, global consumption growth was weaker than production. The data suggest that global CO2 emissions from energy grew at their slowest rate since 1998, other than in the immediate aftermath of the financial crisis.
Emerging economies accounted for all of the net growth in energy consumption, as they have on average over the past decade, although growth in these countries was well below its 10-year average.
Chinese consumption growth was the slowest since 1998, yet China still recorded the world's largest increment in primary energy consumption for the fourteenth consecutive year.
OECD consumption experienced a larger than average decline, with weakness in the EU and Japan offsetting above average growth in the US. Energy consumption in the EU fell to its lowest level since 1985.
Energy prices in 2014 were generally weak, with oil and coal prices falling globally. Gas prices fell in Europe, were relatively flat in Asia, and rose in North America.
The annual average price for Brent, the international crude oil benchmark, declined reflecting a sharp fall in prices in the second half of the year. The differential between Brent and the US benchmark West Texas Intermediate (WTI) narrowed but remained elevated relative to past levels.
As with crude oil prices, differentials between North American and international gas prices generally narrowed but remained wider than historical levels.
BP Statistical Review said world primary energy consumption slowed markedly, with growth of just 0.9 per cent in 2014, a lower rate than at any time since the late 1990s (other than in the immediate aftermath of last decade's financial crisis).
Chinese growth in consumption slowed to its lowest level since 1998 as its economy rebalances away from energy intensive sectors, though China remained the world's largest growth market for energy.
India, however, posted a 7.1 per cent rise in energy consumption, the fastest among major economies and second only to Algeria's 8.4 per cent expansion.
India consumed 637.8 million tonnes of oil and oil equivalent natural gas, coal, nuclear energy, hydro electricity and renewable energy.
This consumption was miniscule in comparison to 2,972.1 million tonnes of oil equivalent energy consumed in China and 2,298.7 million tonnes in the US. It was also lower than Russia's 681.9 million tonnes but more than Japan's 456.1 million tonnes oil equivalent energy consumption.
While India's oil production declined 1.3 per cent at 895,000 bpd, consumption rose 3 per cent to 3.8 million bpd.
Though India is heavily dependent on imports to meet its oil needs, it is self-sufficient in refining capacity, housing a total capacity of 4.3 million bpd, fourth largest in the world behind the US (17.79 million bpd), China (14.09 million bpd) and Russia (6.3 million bpd).
Natural gas production dipped 5.9 per cent to 31.7 billion cubic meters.
BP Group Chief Executive Bob Dudley said, "The eerie calm that had characterised energy markets in the few years prior to 2014 came to an abrupt end last year. However, we should not be surprised or alarmed.
"These events may well come to be viewed as symptomatic of a broader shifting of the tectonic plates that make up the energy landscape, with significant developments in both the supply of energy and its demand. Our task as an industry is to meet today's challenges while continuing to invest to meet tomorrow's demand, safely and sustainably," he added.


