The Hound of Baskervilles snaps at the bears
By Sir Arthur Conan Doyle, | 14 Oct 2005
On Tuesday, October 11, 2005, after opening with gains, there was a sharp and sudden decline and the indices were deep in red. The Sensex went below the 8400 mark as weakness came in from most frontline stocks as they tumbled to their day's lows. Even technology stocks gave up most of their gains and some of them drifted into the red.
Fearing a major correction, many small investors burnt their fingers on the day the markets seemed to fall. Yet, some smart ones made money. Vijay L Bhambwani*, CEO, BSPL India, explains how.
Sir Arthur Conan Doyle, the master story teller and creator of Sherlock Holmes, wrote an adventure and murder mystery that was solved by the ace detective Holmes. The murdered victim owned a dog that failed to bark when the assailant was supposed to have struck. This led Holmes to conclude that the crime was an inside job. In technical parlance, when a pattern or anticipated behaviour in prices does not occur in spite of compelling recent evidence, the phenomena is called the "The Hound of Baskervilles pattern".
It could be a failed "head and shoulders" pattern or a trend-line violation that failed to trigger a bull or bear pattern. This pattern is mentioned on page 105 of Dr Alexander Elders classic book, Trading for a living, published by Wiley Finance.
In the context of domestic market, the recent price volatility has been interpreted by many an analyst in varying degrees of corrective action. Some have called a market "top" and others have termed it as a "routine bull market correction". I am inclined to take a contrarian view here, supplementing my hypothesis with a few graphics. Pictures, as they say, are worth a thousand words.
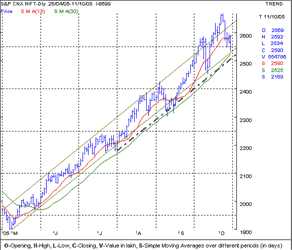
Nifty 50 spot chart - daily view
Any technicals-savvy trader will recognise the channel as a bullish one and a pattern that has been validated by over six months of market activity – a time-frame that grants this pattern respectability and sustainability. The bottom of the channel is close at hand and the solid "bottom trend-line" (the lower trend-line of the two parallel ones in the table above) is at the 2526 levels and the secondary bottom trend-line (shown as thick black dashes) is at the 2512 levels. These supports have held for over half a year – a turbulence that shakes many traders to the core has been seen in that period.
The retracement theory (after every up-move, must come a fall. The magnitude of the fall is specified in the retracement theory) enthusiasts will note that 2555 is a first 32.8-per cent level from the recent significant up-move phase. We have yet to see a consistent close below this level. Falls are on poor volumes and rallies on higher volumes. A 50 per cent correction, for instance, will take it to the 2496 levels, which can be considered a predetermined bottom, now known to us. Barring unforeseen circumstances, this level is likely to hold inspite of routine demand supply imbalances.
The Hound of Baskervilles: The failure of the Nifty to fall below the lower trend-line support and a high degree of short covering (as suggested by the 'forwards and options' [F&O] data spanning October 03 – 11, 2005).
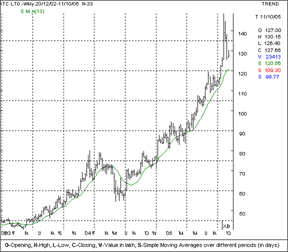
ITC – Weekly chart ( NSE )
This index heavy-weight is near a "retracement support" (support from where the markets are expected to bounce back, says the retracement theory) at the 121 mark, threshold support of 125 on weekly charts and marginally higher than its 13-week simple moving average, also called SMA, which has been a saving grace for the bulls on multiple occasions in the last 14 months. Clearly, the downsides seem well-defined.
The chart above seems to point towards a limited downsides where bulls can initiate long positions and expect a pullback to the 138 / 139 levels in the short / medium term.
The Hound of Baskervilles: The failure of the scrip to fall below the 120 support and volume action suggesting absence of panic sales. Note the rising open interest on the counter on uptick days! (Days on which the closing is higher than the opening are called uptick.)
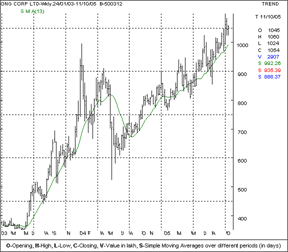
ONGC – Weekly chart
This scrip has signalled a salutary breakout above it's April 2004 top, and managed to keep it's head above that threshold. Overcoming a major 18-month resistance on good volumes and oscillator support makes it unlikely that a major fall is in the offing on this counter. A fall of a few per cents becomes a buy opportunity for a patient bull.
The Hound of Baskervilles: Failure of the scrip to close below the 1020 support and short covering (as suggested by the (F&O) data spanning October 03 - 11, 2005).
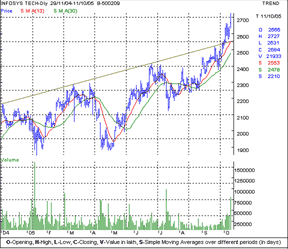
Infosys – daily chart ( NSE )
The first thing that attracts attention in this chart is the rally that we saw on the day of the announcement of numbers, which was due to high volumes. The oscillators (not in the graphic ) support the up-move, the pattern suggests an inverse head and shoulder pattern and volumes support that hypothesis. We know that head and shoulders are measuring moves and enable analysts to project prices going forward. A simple calculation tells us that Infy has a long way to go from here — upwards! The element of time will be a few months, so day traders are unlikely to become billionaires overnight on this counter.
The Hound of Baskervilles: The failure of Infy to fall below the neckline support inspite of market volatility and high degree of open interest as suggested by the (F&O) data spanning October 03 – 11, 2005.
In my view short covering is yet to begin in earnest on this scrip.
To prevent this article from becoming a dull treatise, only a few scrips have been cited. They are all index heavy weights and can sway markets with their price swings. The list is not exhaustive and does not include other heavy-weights like RIL, HLL, Wipro and others. The idea is to justify my view that all the bearish talk on the day the market seemed to panic was nothing but bull and (at the risk of sounding immodest) this is what I said on CNBC on the day itself.
Mandatory disclosure: This analyst has long positions on all the counters covered in this article.
*The author is CEO, BSPL India, a Mumbai-based investments firm.


